目次
![]()
![]()
![]()
![]()
http://blockdiag.com/ja/nwdiag/index.html
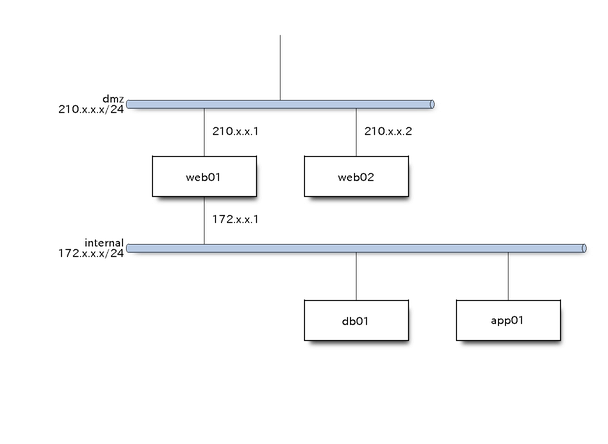
nwdiag {
  network dmz {
      address = "210.x.x.x/24"

      web01 [address = "210.x.x.1"];
      web02 [address = "210.x.x.2"];
  }
  network internal {
      address = "172.x.x.x/24";

      web01 [address = "172.x.x.1"];
      web02 [address = "172.x.x.2"];
      db01;
      db02;
  }
}
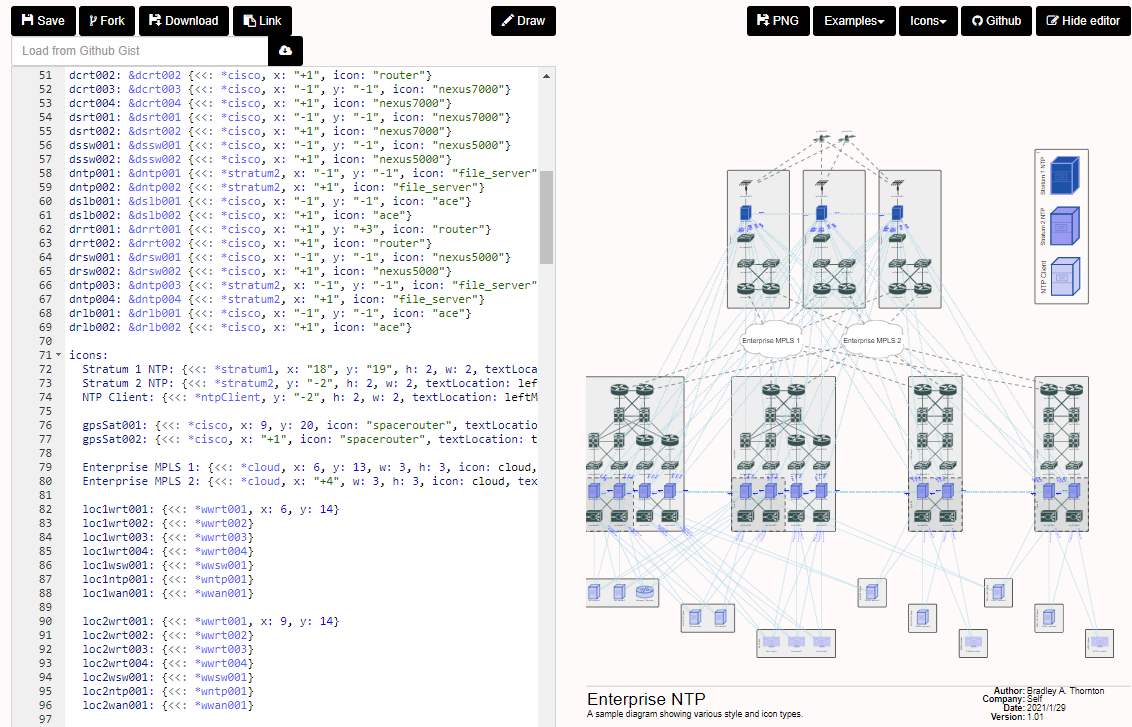
https://diagrams.mingrammer.com/
https://github.com/mingrammer/diagrams
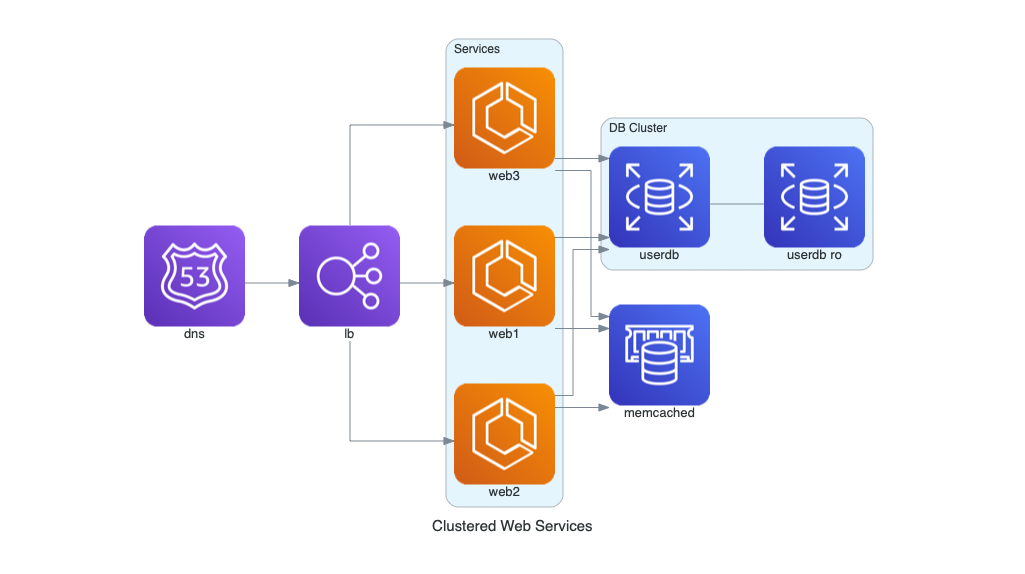
from diagrams import Cluster, Diagram
from diagrams.aws.compute import ECS
from diagrams.aws.database import ElastiCache, RDS
from diagrams.aws.network import ELB
from diagrams.aws.network import Route53

with Diagram("Clustered Web Services", show=False):
    dns = Route53("dns")
    lb = ELB("lb")

    with Cluster("Services"):
        svc_group = [ECS("web1"),
                     ECS("web2"),
                     ECS("web3")]

    with Cluster("DB Cluster"):
        db_master = RDS("userdb")
        db_master - [RDS("userdb ro")]

    memcached = ElastiCache("memcached")

    dns >> lb >> svc_group
    svc_group >> db_master
    svc_group >> memcached
http://rtomaszewski.blogspot.com/2013/12/physical-network-diagram-generated-from.html
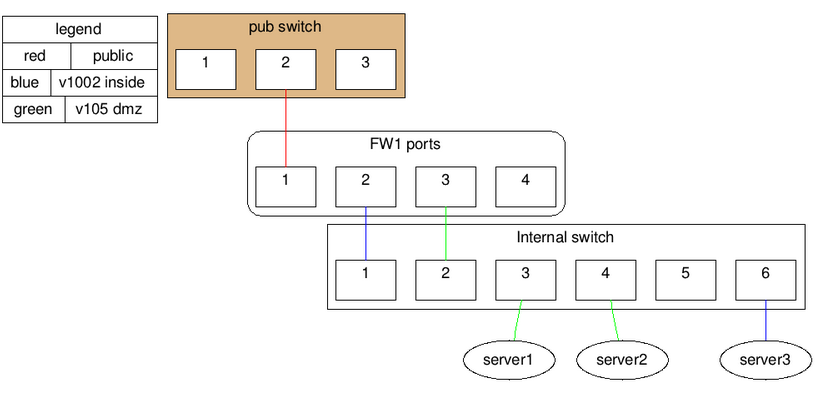
graph physical_net_topology {

legend [ label="{ legend | {red | public} |{blue| v1002 inside} | {green | v105 dmz} }", shape=record];


subgraph cluster_sp {
    label="pub switch";

    graph [ fillcolor="burlywood", style="filled"]
    node [shape=record,fillcolor="white", style="filled"]
    edge[style=invis];

    node [label="3"] p3 ;
    node [label="2"] p2 ;
    node [label="1"] p1 ;

    { rank=same; p1; p2; p3}
    p1 -- p2 -- p3;
}

subgraph cluster_si {
    label="Internal switch";

    edge[style=invis];
    node [shape=record ];

    node [label="1"] e1 ;
    node [label="2"] e2 ;
    node [label="3"] e3 ;
    node [label="4"] e4 ;
    node [label="5"] e5 ;
    node [label="6"] e6 ;

    { rank=same; e1; e2; e3; e4; e5; e6;}
    e1 -- e2 -- e3 -- e4 -- e5 -- e6;
}

subgraph cluster_fw1 {
    label="FW1 ports";

    graph = [ style = rounded]
    edge[style=invis]

    node [shape=record ];
    node [label="1"] f1 ;
    node [label="2"] f2 ;
    node [label="3"] f3 ;
    node [label="4"] f4 ;

  { rank=same; f1; f2; f3; f4; }

  f1 -- f2 -- f3 -- f4'
}

p2 -- f1 [color="red"]
f2 -- e1 [color="blue"]
f3 -- e2 [color="green"]

e3 -- server1 [color="green"]
e4 -- server2 [color="green"]
e6 -- server3 [color="blue"]

}